
Medals Aren't Everything: Germany Named the World's Top Athletic Producer
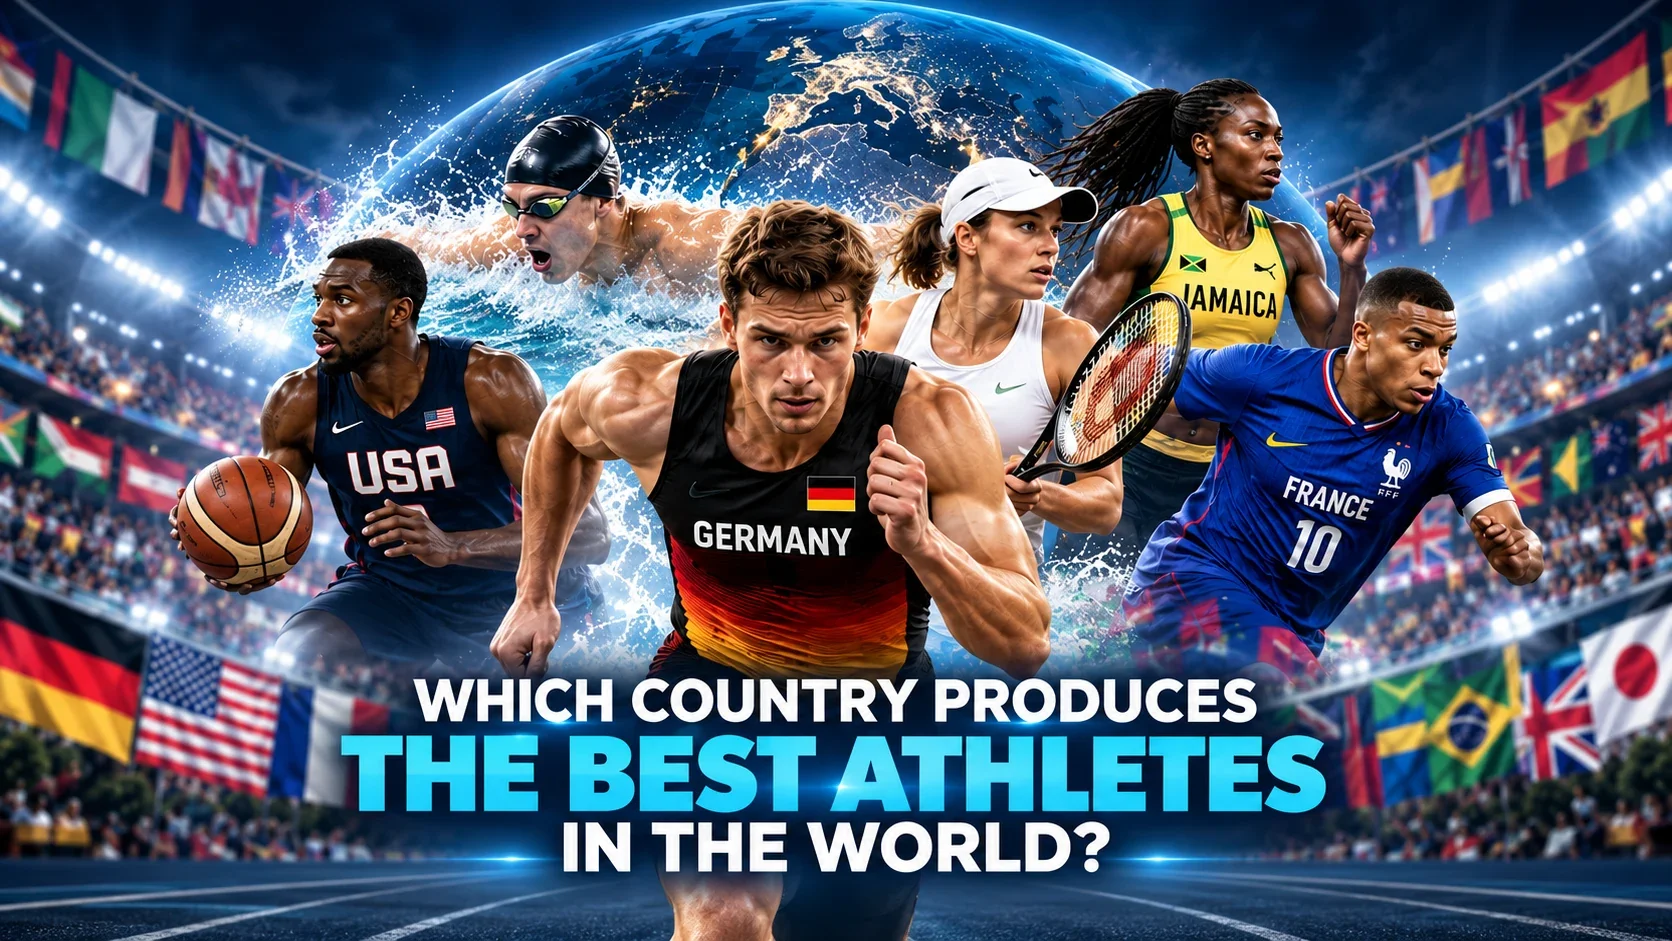
Germany has been named the world's leading producer of elite athletes after a study compared 132 countries across Olympic success, World Championship results, professional football, basketball and tennis.
The research also examined how widely sporting success is spread, how countries perform relative to population, and whether junior talent progresses to senior competition. Those measures were combined into a single Production Score, with Germany setting the benchmark at 100.
Some countries dominate the medal table because of their size. Others consistently produce world-class athletes despite having only a fraction of the population. A new August 2026 study by BettingTop10 looks beyond raw medal totals to find which countries are actually the strongest at producing elite sporting talent.
Key Findings
- Germany ranks first overall, scoring 100 after recording 915 Olympic medals across 48 sports and producing elite athletes across every professional area included in the study.
- Sweden finishes second, showing how strongly smaller countries can perform once population and athlete-development efficiency are taken into account.
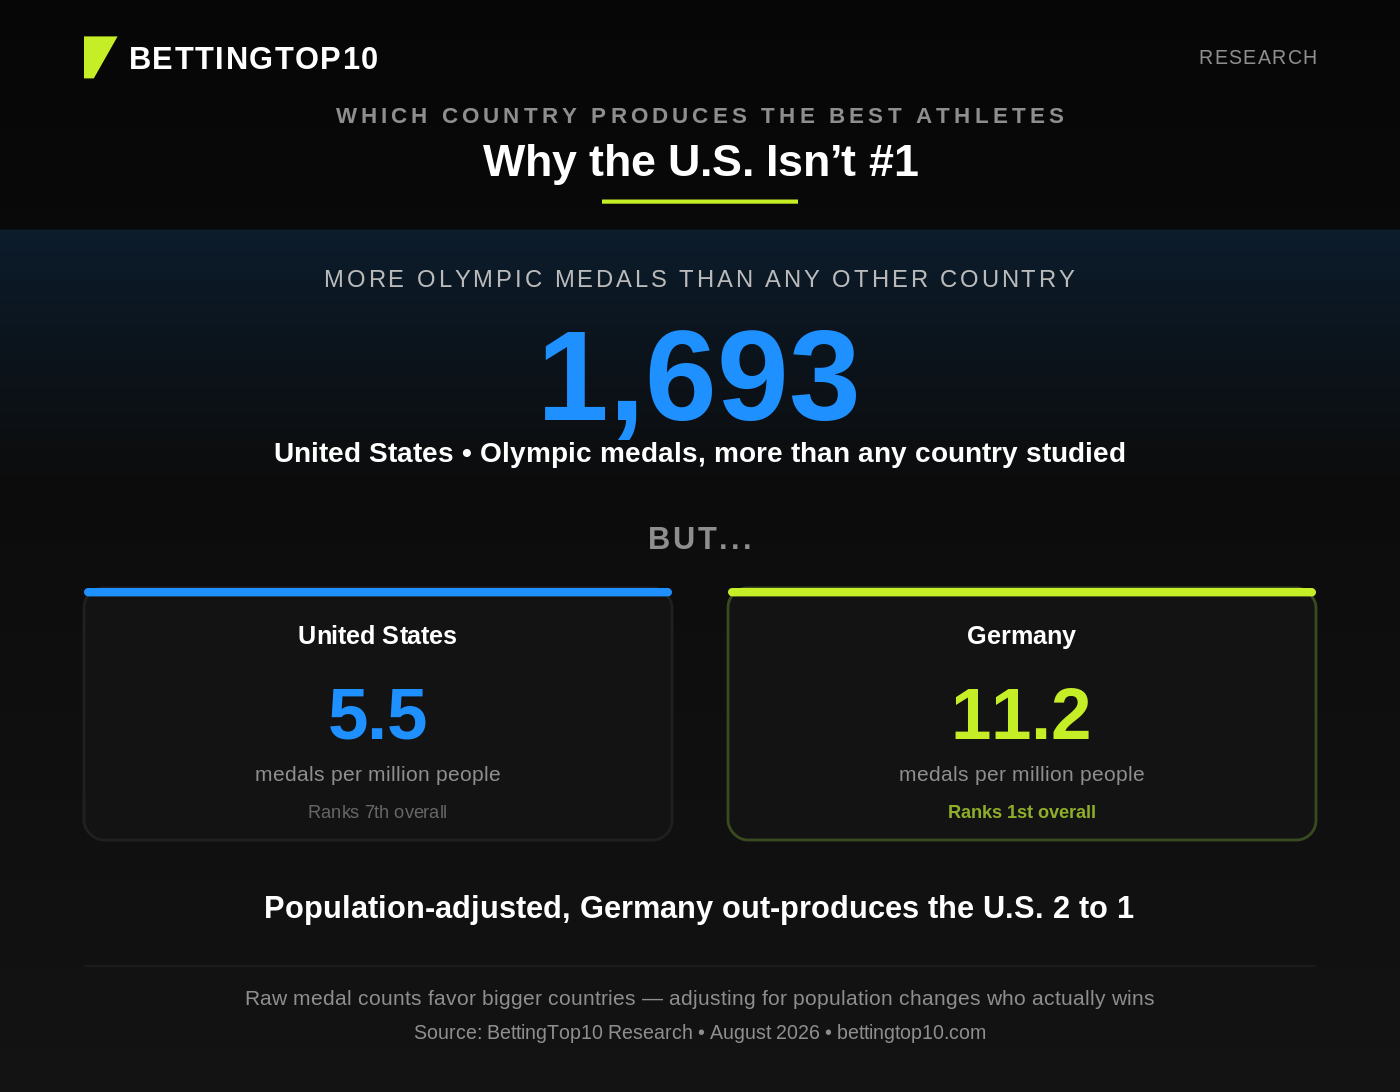
- The United States leads the raw Olympic data with 1,693 medals, but finishes seventh overall because the ranking also measures per-capita output, youth development and conversion to senior success.
Top 10 Countries Producing the Most Elite Athletes
|
Rank |
Country |
Production Score |
Olympic Medals |
Sports Medalled In |
World Champs Golds |
Elite Footballers |
NBA Players |
Tennis Top 100 Players |
|
1 |
Germany |
100 |
915 |
48 |
126 |
225 |
21 |
35 |
|
2 |
Sweden |
97.9 |
300 |
24 |
33 |
35 |
4 |
11 |
|
3 |
France |
97.6 |
469 |
37 |
34 |
374 |
59 |
55 |
|
4 |
United Kingdom |
97.3 |
496 |
36 |
51 |
359 |
14 |
10 |
|
5 |
Netherlands |
97.1 |
426 |
27 |
20 |
152 |
9 |
15 |
|
6 |
Australia |
96.8 |
683 |
30 |
97 |
4 |
39 |
27 |
|
7 |
United States |
95.1 |
1,693 |
52 |
358 |
31 |
2,074* |
60 |
|
8 |
Spain |
94.1 |
251 |
29 |
18 |
358 |
21 |
45 |
|
9 |
Italy |
93.3 |
421 |
38 |
39 |
200 |
14 |
30 |
|
10 |
Norway |
91.9 |
312 |
21 |
13 |
23 |
1 |
2 |
1
Country
Germany
Production Score
100
Olympic Medals
915
Sports Medalled In
48
World Champs Golds
126
Elite Footballers
225
NBA Players
21
Tennis Top 100 Players
35
2
Country
Sweden
Production Score
97.9
Olympic Medals
300
Sports Medalled In
24
World Champs Golds
33
Elite Footballers
35
NBA Players
4
Tennis Top 100 Players
11
3
Country
France
Production Score
97.6
Olympic Medals
469
Sports Medalled In
37
World Champs Golds
34
Elite Footballers
374
NBA Players
59
Tennis Top 100 Players
55
4
Country
United Kingdom
Production Score
97.3
Olympic Medals
496
Sports Medalled In
36
World Champs Golds
51
Elite Footballers
359
NBA Players
14
Tennis Top 100 Players
10
5
Country
Netherlands
Production Score
97.1
Olympic Medals
426
Sports Medalled In
27
World Champs Golds
20
Elite Footballers
152
NBA Players
9
Tennis Top 100 Players
15
6
Country
Australia
Production Score
96.8
Olympic Medals
683
Sports Medalled In
30
World Champs Golds
97
Elite Footballers
4
NBA Players
39
Tennis Top 100 Players
27
7
Country
United States
Production Score
95.1
Olympic Medals
1,693
Sports Medalled In
52
World Champs Golds
358
Elite Footballers
31
NBA Players
2,074*
Tennis Top 100 Players
60
8
Country
Spain
Production Score
94.1
Olympic Medals
251
Sports Medalled In
29
World Champs Golds
18
Elite Footballers
358
NBA Players
21
Tennis Top 100 Players
45
9
Country
Italy
Production Score
93.3
Olympic Medals
421
Sports Medalled In
38
World Champs Golds
39
Elite Footballers
200
NBA Players
14
Tennis Top 100 Players
30
10
Country
Norway
Production Score
91.9
Olympic Medals
312
Sports Medalled In
21
World Champs Golds
13
Elite Footballers
23
NBA Players
1
Tennis Top 100 Players
2
The US Has the Most Medals, So Why Is It Only Seventh?
No country comes close to the United States when the biggest raw totals are considered.
The US recorded 1,693 Olympic medals, compared with 967 for Russia and 915 for Germany. It also leads with 358 World Championship gold medals, medals across 52 Olympic sports, and 60 ATP top-100 players.
But the study deliberately does not reward size alone.
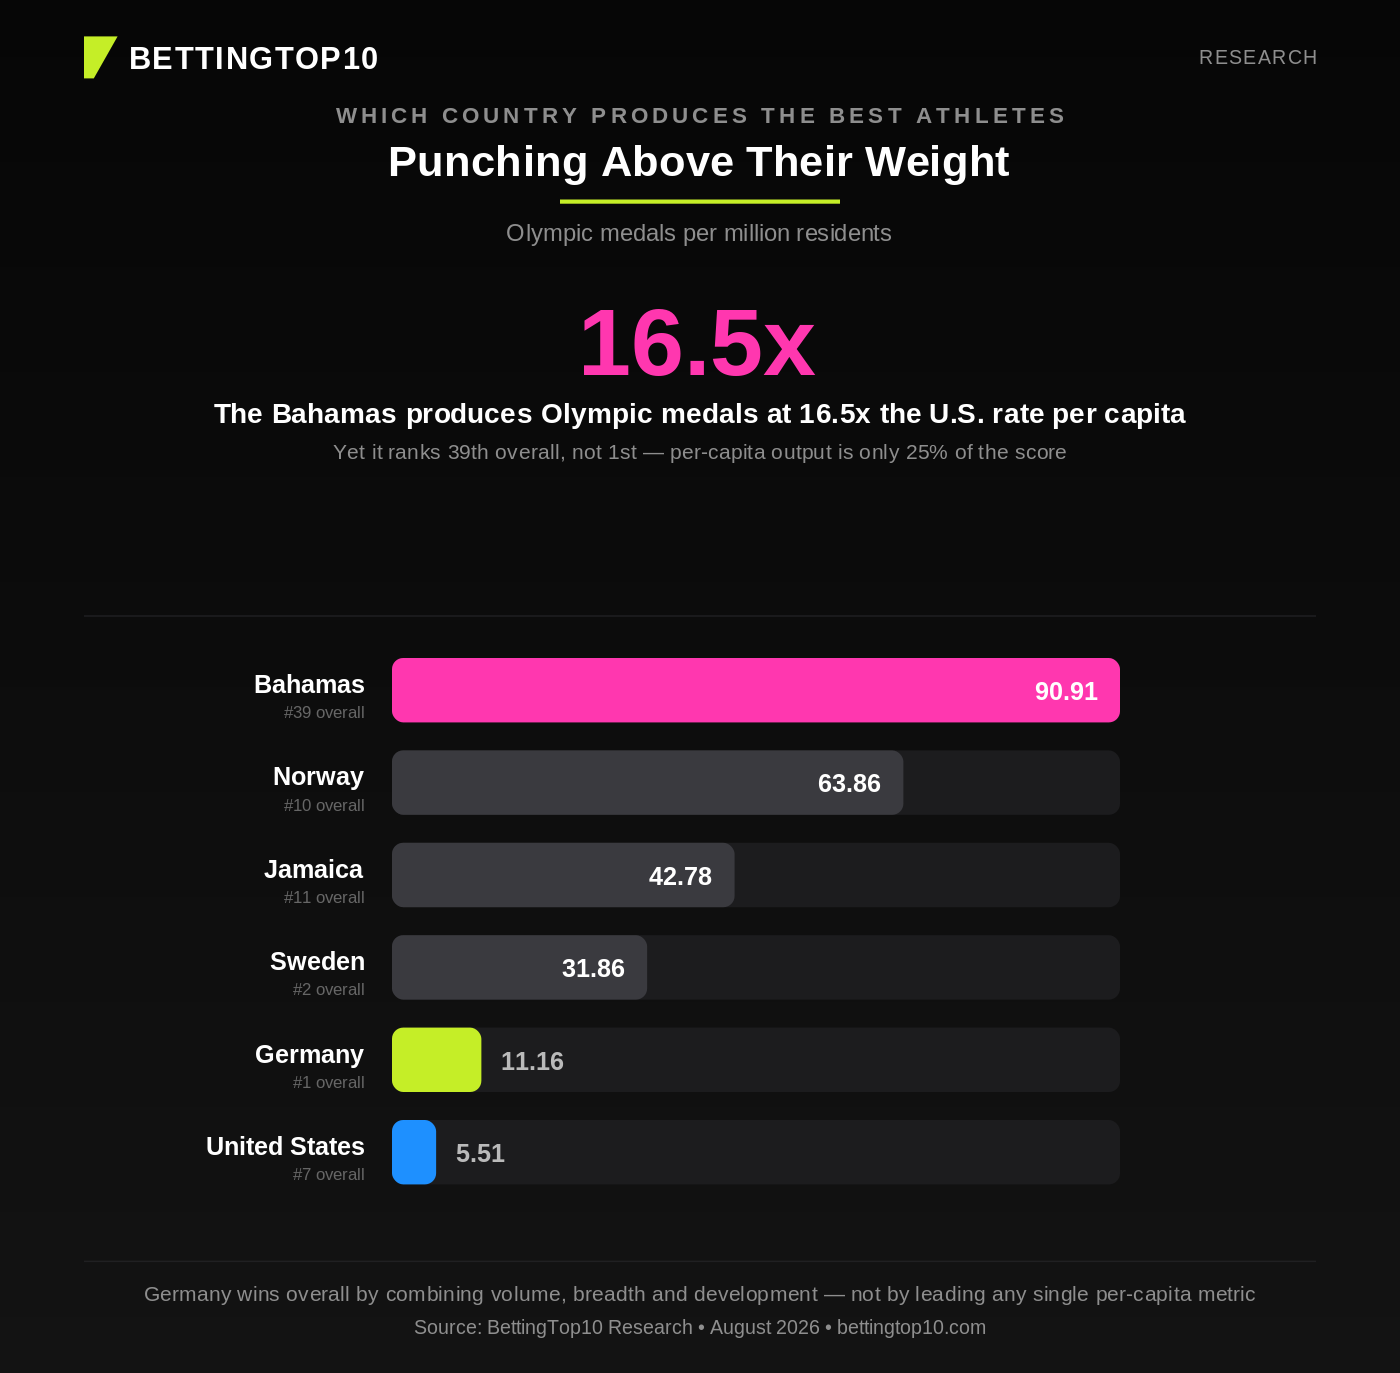
Once population is taken into account, the picture changes considerably. The US records about 5.5 Olympic medals per million people in the dataset, compared with 11.2 for Germany, 31.9 for Sweden and 63.9 for Norway.
That difference helps explain why the US, despite dominating overall medal production, finishes seventh with a Production Score of 95.1.
1. Germany
Germany's biggest advantage is that it performs well almost everywhere rather than relying on one sport.
The country recorded 915 Olympic medals across 48 sports, second only to the US for sporting breadth among the leading nations. It also collected 371 World Championship medals, including 126 golds.
Its professional-sport numbers are equally broad, with 225 elite footballers, 21 NBA players and 35 ATP top-100 tennis players represented in the study.
Germany also recorded 126 junior World Championship medallists, giving it one of the strongest development pipelines in the dataset.
2. Sweden
Sweden's second-place finish is one of the clearest examples of why the study includes population-adjusted results.
The country recorded 300 Olympic medals across 24 sports, substantially fewer than Germany or the US in raw terms. On a per-capita basis, however, Sweden produces about 31.9 Olympic medals per million residents in the dataset.
It has also produced 35 elite footballers, four NBA players and 11 ATP top-100 players. Around 28.6% of its junior medallists progressed to senior success, adding to a particularly strong development-quality result.
3. France
France ranks third overall and leads every other country in the study for the number of qualifying elite footballers.
A total of 374 French-born players reached the football threshold used in the research. That puts France just ahead of the United Kingdom with 359 and Spain with 358.
France is far from a football-only country, however. It also recorded 469 Olympic medals across 37 sports, 34 World Championship golds, 59 NBA players and 55 ATP top-100 tennis players.
Only the United States produced more top-100 tennis players in the dataset.
4. United Kingdom
The United Kingdom takes fourth place after performing strongly across Olympic sport, football and junior development.
British athletes recorded 496 Olympic medals across 36 sports, together with 168 World Championship medals, including 51 golds.
The UK also produced 359 elite footballers, placing it second only to France on that measure.
Its youth pipeline is another strength. The study recorded 60 junior World Championship medallists, with roughly one in four going on to achieve senior success.
5. Netherlands
The Netherlands rounds out the top five and is another country whose results look particularly strong relative to its size.
Dutch athletes recorded 426 Olympic medals across 27 sports, with 268 individual medallists among 851 athletes sent in the Olympic dataset.
That produces a medallist rate of about 31.5%, meaning nearly one in three athletes represented in that part of the study became medallists.
The Netherlands also contributed 152 elite footballers, nine NBA players and 15 ATP top-100 tennis players.
Smaller Countries Are Punching Well Above Their Weight
The top 10 contains several nations that would struggle to compete with the biggest countries on raw athlete numbers alone.
Norway is the clearest example. It ranks 10th overall with a score of 91.9 despite much lower raw totals than the US, Germany or China. Its 312 Olympic medals translate to roughly 63.9 medals per million residents, the second-highest rate in the study behind the Bahamas.
Jamaica sits immediately outside the top 10 and also records a Production Score of 91.9 when rounded. It has around 42.8 Olympic medals and 76.8 World Championship medals per million residents, alongside particularly strong youth-pipeline and development-quality results.
The Bahamas takes the per-capita Olympic medal crown at about 90.9 medals per million, yet ranks only 39th overall. That illustrates the other side of the methodology: exceptional performance in one area is not enough on its own when sporting breadth, overall output and development are also considered.
The results show why medal totals alone don't tell the whole story. The United States produces enormous numbers of elite athletes, but countries such as Germany, Sweden and Norway remain competitive because they combine success across different sports with strong results relative to their population.
Germany stands out because there isn't one single area carrying its score. It has Olympic breadth, world champions and a strong presence across football, basketball and tennis, which is exactly the kind of balance this ranking is designed to reward.
Heather Gartland, BettingTop10 Analyst
What's Actually Driving the Rankings?
The Production Score is designed to reward countries that produce athletes in several different ways rather than simply giving the title to the nation with the biggest population or medal count.
Output Volume accounts for 30% of the final score. This covers weighted Olympic and World Championship medals, elite footballers, NBA players and ATP top-100 appearances.
Another 25% comes from Output Rate, which adjusts major sporting outputs for population.
Breadth contributes 15%, rewarding countries that win medals across different Olympic sports and are represented in several major professional sporting areas.
The remaining 30% is split equally between Pipeline and Development Quality. These measures look at junior success, junior results per capita, progression into senior competition and the proportion of athletes sent who ultimately become medallists.
This helps explain some of the biggest differences in the ranking. The US leads in raw output but loses ground when population is factored in. Jamaica is highly efficient at developing elite athletes but has much narrower sporting breadth. Germany scores consistently across almost every part of the model.
The Complete Ranking: All 132 Countries
|
Rank |
Country |
Production Score |
|
1 |
Germany |
100 |
|
2 |
Sweden |
97.9 |
|
3 |
France |
97.6 |
|
4 |
United Kingdom |
97.3 |
|
5 |
Netherlands |
97.1 |
|
6 |
Australia |
96.8 |
|
7 |
United States |
95.1 |
|
8 |
Spain |
94.1 |
|
9 |
Italy |
93.3 |
|
10 |
Norway |
91.9 |
|
11 |
Jamaica |
91.9 |
|
12 |
Russia |
91.5 |
|
13 |
Switzerland |
91.2 |
|
14 |
Croatia |
90.7 |
|
15 |
Hungary |
89.3 |
|
16 |
Finland |
87 |
|
17 |
Poland |
85.3 |
|
18 |
Ukraine |
84.4 |
|
19 |
Japan |
84.3 |
|
20 |
Romania |
83.6 |
|
21 |
Bulgaria |
83.2 |
|
22 |
Greece |
82.4 |
|
23 |
Denmark |
82.4 |
|
24 |
Brazil |
81 |
|
25 |
South Korea |
80.9 |
|
26 |
Slovenia |
80.8 |
|
27 |
New Zealand |
80.1 |
|
28 |
Belgium |
79.9 |
|
29 |
Cuba |
77.7 |
|
30 |
China |
76.7 |
|
31 |
Austria |
76.6 |
|
32 |
Portugal |
76.1 |
|
33 |
Argentina |
75.5 |
|
34 |
Trinidad and Tobago |
74.8 |
|
35 |
Belarus |
74.1 |
|
36 |
Slovakia |
73.5 |
|
37 |
Czech Republic |
72.8 |
|
38 |
South Africa |
72.5 |
|
39 |
Bahamas |
72.5 |
|
40 |
Colombia |
71.4 |
|
41 |
Lithuania |
70.4 |
|
42 |
Nigeria |
70.4 |
|
43 |
Iceland |
69.7 |
|
44 |
Kenya |
69.6 |
|
45 |
Canada |
66.9 |
|
46 |
Estonia |
66.5 |
|
47 |
Latvia |
66.3 |
|
48 |
Morocco |
65.8 |
|
49 |
Ireland |
65.2 |
|
50 |
Mexico |
64.5 |
|
51 |
Georgia |
64.2 |
|
52 |
Bosnia and Herzegovina |
62.2 |
|
53 |
Kazakhstan |
62 |
|
54 |
Turkey |
61.7 |
|
55 |
Israel |
60.8 |
|
56 |
Cameroon |
59.3 |
|
57 |
Ethiopia |
57.7 |
|
58 |
Dominican Republic |
57.5 |
|
59 |
Algeria |
56.3 |
|
60 |
Iran |
56.2 |
|
61 |
Qatar |
56.1 |
|
62 |
Grenada |
55.7 |
|
63 |
Tunisia |
55.2 |
|
64 |
Zimbabwe |
55.1 |
|
65 |
Paraguay |
54.2 |
|
66 |
Uzbekistan |
53.9 |
|
67 |
Serbia |
53.4 |
|
68 |
Ecuador |
53.3 |
|
69 |
Montenegro |
52.6 |
|
70 |
Ivory Coast |
52.6 |
|
71 |
Chile |
51.6 |
|
72 |
Uganda |
50.9 |
|
73 |
Egypt |
49.5 |
|
74 |
Venezuela |
49.1 |
|
75 |
Armenia |
46.5 |
|
76 |
Burundi |
46 |
|
77 |
Senegal |
45.2 |
|
78 |
Botswana |
45.2 |
|
79 |
Uruguay |
44.8 |
|
80 |
Azerbaijan |
44.6 |
|
81 |
Indonesia |
43 |
|
82 |
Kyrgyzstan |
42.7 |
|
83 |
Barbados |
42.6 |
|
84 |
Kuwait |
42.5 |
|
85 |
Albania |
42.5 |
|
86 |
Monaco |
42.1 |
|
87 |
Ghana |
42 |
|
88 |
North Korea |
41.9 |
|
89 |
Panama |
41.3 |
|
90 |
Tajikistan |
41.2 |
|
91 |
Djibouti |
41.1 |
|
92 |
Thailand |
41.1 |
|
93 |
Fiji |
41 |
|
94 |
Moldova |
41 |
|
95 |
US Virgin Islands |
40.8 |
|
96 |
Eritrea |
40.7 |
|
97 |
Chinese Taipei |
39.7 |
|
98 |
Puerto Rico |
39.6 |
|
99 |
India |
38.8 |
|
100 |
Sudan |
38.5 |
|
101 |
Saudi Arabia |
37.4 |
|
102 |
Kosovo |
36.7 |
|
103 |
Mongolia |
36.2 |
|
104 |
Cyprus |
36.1 |
|
105 |
Mozambique |
35.2 |
|
106 |
Samoa |
34.3 |
|
107 |
Hong Kong |
33.6 |
|
108 |
Singapore |
33.3 |
|
109 |
Gabon |
33.2 |
|
110 |
Malawi |
33 |
|
111 |
Vietnam |
31.2 |
|
112 |
Somalia |
30.1 |
|
113 |
Liechtenstein |
29.9 |
|
114 |
Malaysia |
29.8 |
|
115 |
Jordan |
29.2 |
|
116 |
Benin |
27.9 |
|
117 |
Solomon Islands |
27.8 |
|
118 |
Turkmenistan |
27.5 |
|
119 |
United Arab Emirates |
27.4 |
|
120 |
Republic of Congo |
26.6 |
|
121 |
Andorra |
25.9 |
|
122 |
Nicaragua |
24.3 |
|
123 |
Philippines |
24.1 |
|
124 |
Syria |
23.5 |
|
125 |
Afghanistan |
22.8 |
|
126 |
Sri Lanka |
22.2 |
|
127 |
Pakistan |
20 |
|
128 |
Papua New Guinea |
19.5 |
|
129 |
Niger |
19.1 |
|
130 |
Mauritius |
19.1 |
|
131 |
El Salvador |
18.5 |
|
132 |
Guatemala |
16.9 |
Metric Methodology
The study assessed 132 countries using five broad scoring categories. Each underlying metric was converted to a percentile score between 0 and 100 before the categories were combined.
|
Category |
Weight |
|
Output Volume |
30% |
|
Output Rate |
25% |
|
Breadth |
15% |
|
Pipeline |
15% |
|
Development Quality |
15% |
|
Total |
100% |
The detailed individual factors were weighted as follows:
|
Metric |
Weight |
|
Olympic Medals per Million Residents |
8.3% |
|
Weighted World Championship Medals per Million Residents |
8.3% |
|
Elite Footballers per Million Residents |
8.3% |
|
Number of Olympic Sports Medalled In |
7.5% |
|
Number of Professional Domains Represented In |
7.5% |
|
Junior World Championship Medallists |
7.5% |
|
Junior World Championship Medallists per Million Residents |
7.5% |
|
Junior-to-Senior Conversion Rate |
7.5% |
|
Medallist Rate |
7.5% |
|
Weighted Olympic Medals |
6% |
|
Weighted World Championship Medals |
6% |
|
Elite Footballers Born in Country |
6% |
|
NBA Players Born in Country |
6% |
|
ATP Top 100 Player-Seasons |
6% |
The individual weights total approximately 100%, with a small difference caused by rounding.
Olympic medal data covers 2000 to 2019, while the other datasets span different periods according to availability. World Championship data covers athletics and swimming, tennis data is men's ATP data, and junior-development measures are based on athletics.
Athletes are attributed according to country of birth rather than the nation they later represented, where birthplace information was available.
The study does not include every major sport. Cricket, baseball, rugby and combat sports are among those excluded, meaning countries with particular strength in those areas may rank lower than their overall sporting reputation would suggest.
The complete research findings can be viewed here.


The results show why medal totals alone don't tell the whole story. The United States produces enormous numbers of elite athletes, but countries such as Germany, Sweden and Norway remain competitive because they combine success across different sports with strong results relative to their population.